How to use grids
If you want to add grids to your charts you should study the following nodes and attributes:
- <chart>
- minimum_value
- maximum_value
- minimum_argument
- maximum_argument
- <x_axis>
- <y_axis>
- <grid>
Full description of these nodes
can be found in XML reference, but you should know a little
bit more about their interaction.
First of all you should decide are your data (values and arguments) limited by some fixed minimum and maximum numbers, if so - it is highly recommended to set these margins in <chart> node:
| <chart maximum_value = "100" minimum_value="0" maximum_argument="100" minimum_argument="-100"/> |
If your data is not limited then you may find useful smart attributes of x or y axis (arguments and values axis), enabling 'smart' attribute allows AnyChart to find more suitable size of charts and grid step, start and end values:
<x_axis smart="yes" />
<y_axis smart="yes" /> |
Even if maximum, minimum values and smart are set grid wouldn't be shown, to show the grid you should at least enable it:
<x_axis smart="yes" />
<y_axis smart="yes" />
<grid>
<values />
<arguments />
</grid> |
Also you can set custom grid steps for both x and y axis:
<grid>
<values lines_step="5"/>
<arguments lines_step="5" />
</grid> |
Note: you can combine 'lines_step' attribute of <values> and <arguments> with 'smart' attribute of y and x axis accordingly, but you should provide some lines step value if you don't set smart feature on.
Somtimes you may need to draw grid that covers only part of chart, to accomplish this you can set 'start' and 'end' attributes of <values> and <arguments> nodes:
<grid>
<values lines_step="5" start="0" end="20" />
<arguments lines_step="5" start="10" end="30" />
</grid> |
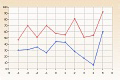
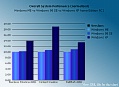
Study XML settings of the following charts from gallery to see how all these stuff works:
|