Using interactive animated AnyChart Flash Charts in PowerPoint
AnyChart is a flexible component for creation charts not only for Web, you can use AnyChart in PowerPoint as well.
We will show how to embed chart into presentation in the following tutorial. It is assumed that you've already created an XML file that configures the chart.
Create and Save PowerPoint presentation
Create new PowerPoint presentation and save it to some folder on your computer. It is recommended to save AnyChart SWF and XML files into the same folder, although you can store them where you want to. In our sample we will use 3D column chart, so we saved 3D-Column.swf:
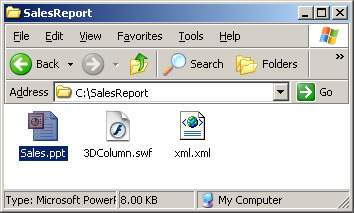
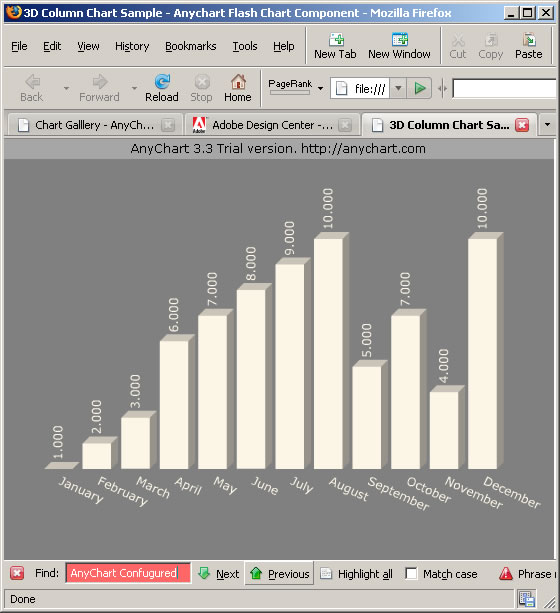
Also we've configured xml.xml file to show company sales data, and checked it in the browser. This file is also saved in our presentations folder.
Insert Flash object into presentation
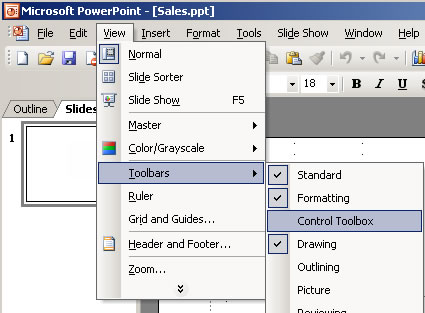
Please click View -> Toolbars -> Control Toolbox in PowerPoint,:
Locate More Controls button in that toolbar and choose Shockwave Flash Object:

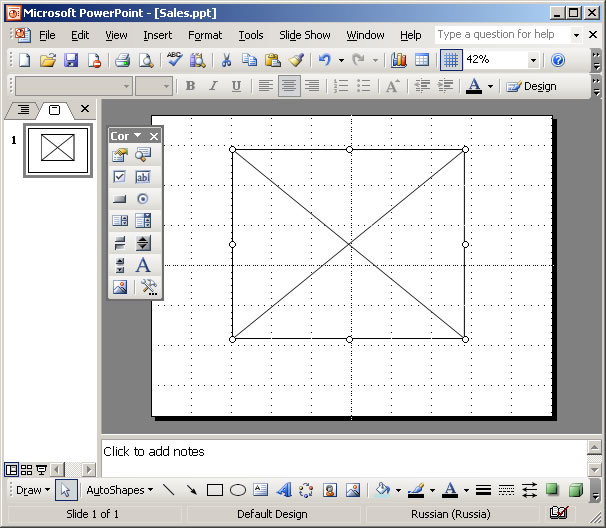
Then click on your slide and adjust the size of the chart. You will see something like that:
Right-click on the object and select Properties:

You will see Proprieties window, click [...] on the left of (Custom) and you will see custom properties window:
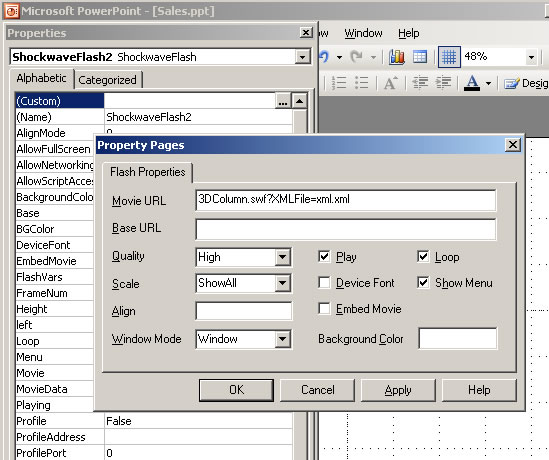
As you can see on the picture above you need to provide an SWF file name (Movie URL), followed by ?XMLFile=xml.xml
In our sample we use 3DColumn.swf to show animated sales data. All settings are stored in xml.xml, so we've set Movie URL to:
3DColumn.swf?XMLFile=xml.xml
After pasting Movie URL click OK.
The flash movie will not be shown in PPT immediately. You should view presentation (click F5 or View->Slide Show).
Here it is - we've added AnyChart Flash Charts into PowerPoint presentation.

Note:
The SWF file and XML file are not embedded into Presentation file (PPT), you need to copy them with presentation file when you are moving presentation from one PC to another.
You can download the sample described above here: AnyChart-Flash-Chart-in-Powerpoint.zip
|


