Creating a chart with AnyChart Flash Chart Component
AnyChart is a flexible component for creation charts in Web, so let's see step by step how to create a page with chart.
Create a web page
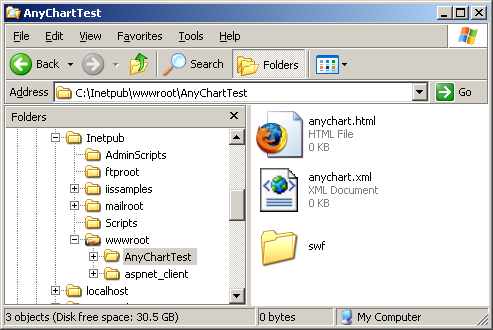
First af all we need a plain HTML page that contains a Flash object, and place it to some folder on your web site:
Below we've done it, creating AnyChartTest folder in IIS wwwroot folder:
Terms
Container page: a page where chart will be displayed;
it should contain <object> tag that will hold a Flash object linking
to one of AnyChart SWF files, this page can be HTML, ASP,
ASP.NET, CF, PHP, CGI, Perl (or any other scripting language capable to produce
HTML output).
Data provider: AnyChart accepts all data needed to show tha chart
in a single XML File. The structure of this file will be explained later.
Chart SWF: Every chart type displayed by AnyChart is contained in a separate swf file - that is why we created an swf subfolder.
Choosing Chart data and its visual style
As we are creating a chart we need some data for it. Imagine that we want to compare in a visual manner
top ten Western Pennsylvania's companies. So, we have the following numbers:
| Company |
Market cap ($millions) |
| Alcoa |
$26,765 |
| PNC Financial Services Group |
$26,445 |
| Mellon Financial |
$14,826 |
| H.J. Heinz Co. |
$12,674 |
| PPG Industries |
$10,317 |
| U.S. Steel |
$6,300 |
| Consol Energy Inc. |
$6,208 |
| Allegheny Energy |
$5,813 |
| Allegheny Technologies |
$5,581 |
| Mylan Laboratories |
$4,837 |
To transmit this data to AnyChart component we need to convert it to XML, like that:
<?xml version="1.0"?>
<root>
<type>
<chart type="Horizontal 2DColumn" maximum_value="35000">
<values decimal_places="0" thousand_separator = "," prefix="$"/>
<animation enabled="no"/>
<column_chart left_space = "210" right_space="30" up_space = "10" down_space = "10"/>
</chart>
<workspace>
<chart_area width="400" height="300" deep="0">
<border enabled="yes" color="0xB54001" />
</chart_area>
<base_area enabled="no"/>
<name text="The 10 Market Cap Companies of Western Pennsylvania"/>
<subname text="in mil.$"/>
</workspace>
</type>
<data>
<block>
<set name="Alcoa" value="26765" color="0x418CF0"/>
<set name="PNC Financial Services Group" value="26445" color="0x4D8FE5"/>
<set name="Mellon Financial" value="14826" color="0x7397C1"/>
<set name="H.J. Heinz Co." value="12674" color="0x839AB2"/>
<set name="PPG Industries" value="10317" color="0xABA38D"/>
<set name="U.S. Steel" value="6300" color="0xC9A971"/>
<set name="Consol Energy Inc." value="6208" color="0xDBAD60"/>
<set name="Allegheny Energy" value="5813" color="0xEFB14D"/>
<set name="Allegheny Technologies" value="5581" color="0xFAB442"/>
<set name="Mylan Laboratories" value="4837" color="0xCB9236"/>
</block>
</data>
</root> |
Now copy the above code, open anychart.xml from AnyChartTest folder in any plain text editor and paste code there.
XML structure may look complex, but most of the tags are self descriptive and we can describe everything done in XML in several words:
- In <type> node we described how our chart should look like:
- We've set a chart type - <chart type="Horizontal 2DColumn">
- We've set a size of our chart - <chart_area width="400" height="300">
- We've set a name of our chart - <name text="The 10 Market Cap Companies of Western Pennsylvania"/>
- We've turned off the animation - <animation enabled="no"/>
- We've positioned our column chart within chart area -
<column_chart left_space = "210" right_space="30" up_space = "10" down_space = "10"/>
- We've enabled a border for chart area - <border enabled="yes" color="0xB54001" />
- In <data> we've created one <block> of data (we will need more blocks when building a multiseries charts)
- In <block> we've added one <set> node for each company in our table, entered it's name and capitalization, along with the color, that will be used on chart to show the given element.
e.g. <set name="Alcoa" value="26765" color="0x418CF0"/>
HTML File structure
Only one step remains and we will see our chart on the Web!
Here is the code you should paste in anychart.html (just open it in any text editor and copy-paste the code):
<html>
<head><title>AnyChart Sample</title></head>
<body>
<object
classid="clsid:d27cdb6e-ae6d-11cf-96b8-444553540000" codebase="http://fpdownload.macromedia.com/pub/shockwave/cabs/flash/swflash.cab#version=7,0,0,0"
width="550"
height="400"
align="middle" id="AnyChart">
<param name="allowScriptAccess" value="sameDomain"/>
<param name="movie" value="./swf/Horizontal2DColumn.swf" />
<param name="FlashVars" value="XMLFile=anychart.xml">
<param name="quality" value="high" />
<param name="bgcolor" value="#ffffff" />
<embed name = "AnyChart"
src="./swf/Horizontal2DColumn.swf" flashvars = "XMLFile=anychart.xml"
quality="high"
bgcolor="#ffffff"
width="550"
height="400" align="middle"
allowScriptAccess="sameDomain"
type="application/x-shockwave-flash" pluginspage="http://www.macromedia.com/go/getflashplayer" />
</object>
</body>
</html>
|
Only text in bold is the html code, that you need to embed AnyChart into a HTML page.
The explanation of this code is simple, but requires attention:
We've inserted an <object> and <embed> tag, that holds an information about Flash movie inserted into HTML page, we've set that swf used is Horizontal2DColumn.swf and supplied it with the parameter that points to XML Data file:
<param name="movie" value="./swf/Horizontal2DColumn.swf?XMLFile=anychart.xml" />
<param name="FlashVars" value="XMLFile=anychart.xml">
and
<embed name = "AnyChart" src="./swf/Horizontal2DColumn.swf" flashvars = "XMLFile=anychart.xml">
Why should we use all these HTML tags? What do they do?
The OBJECT tag is for Internet Explorer 3.0 or later on Windows 9x/2000/NT/ME/XP platforms or any browser that supports the use of the Flash ActiveX control. The "classid" must appear exactly as it does in this example. The "codebase" attribute must also appear exactly as it does in this example; it tells the browser where to find Flash Player for automatic download. Internet Explorer 3.0 or later on Windows 9x/2000/NT/ME/XP will prompt the user with a dialog asking if they would like to auto-install the Flash Player if it's not already installed. This process can occur without the user having to restart the browser.
The EMBED tag is for Netscape Navigator 2.0 or later, or browsers that support the use of the Netscape-compatible plugin version of Flash Player. The "pluginspage" attribute tells the browser where to direct the user to find Flash Player for download if the Player is not already installed. The user would then need to download and run the installer and restart their browser.
To ensure that the most browsers will play your Flash Player movies, you should place the EMBED tag nested within the OBJECT tag as shown in the above example. ActiveX-enabled browsers will "ignore" the EMBED tag inside the OBJECT tag. Netscape and Microsoft browsers using the Flash Plugin will not recognize the OBJECT tag and will read only the EMBED tag.
See the full explanation of embedding Flash into HTML page at Adobe Flash website: Flash TechNote - Macromedia Flash OBJECT and EMBED tag syntax
Final
Now we should launch our html page in a web browser, in our case we can use both:
http://localhost/AnyChartTest/anychart.html
or
C:\Inetpub\wwwroot\AnyChartTest\anychart.html
If everything was done exactly as described above, you will see the following chart:

|


